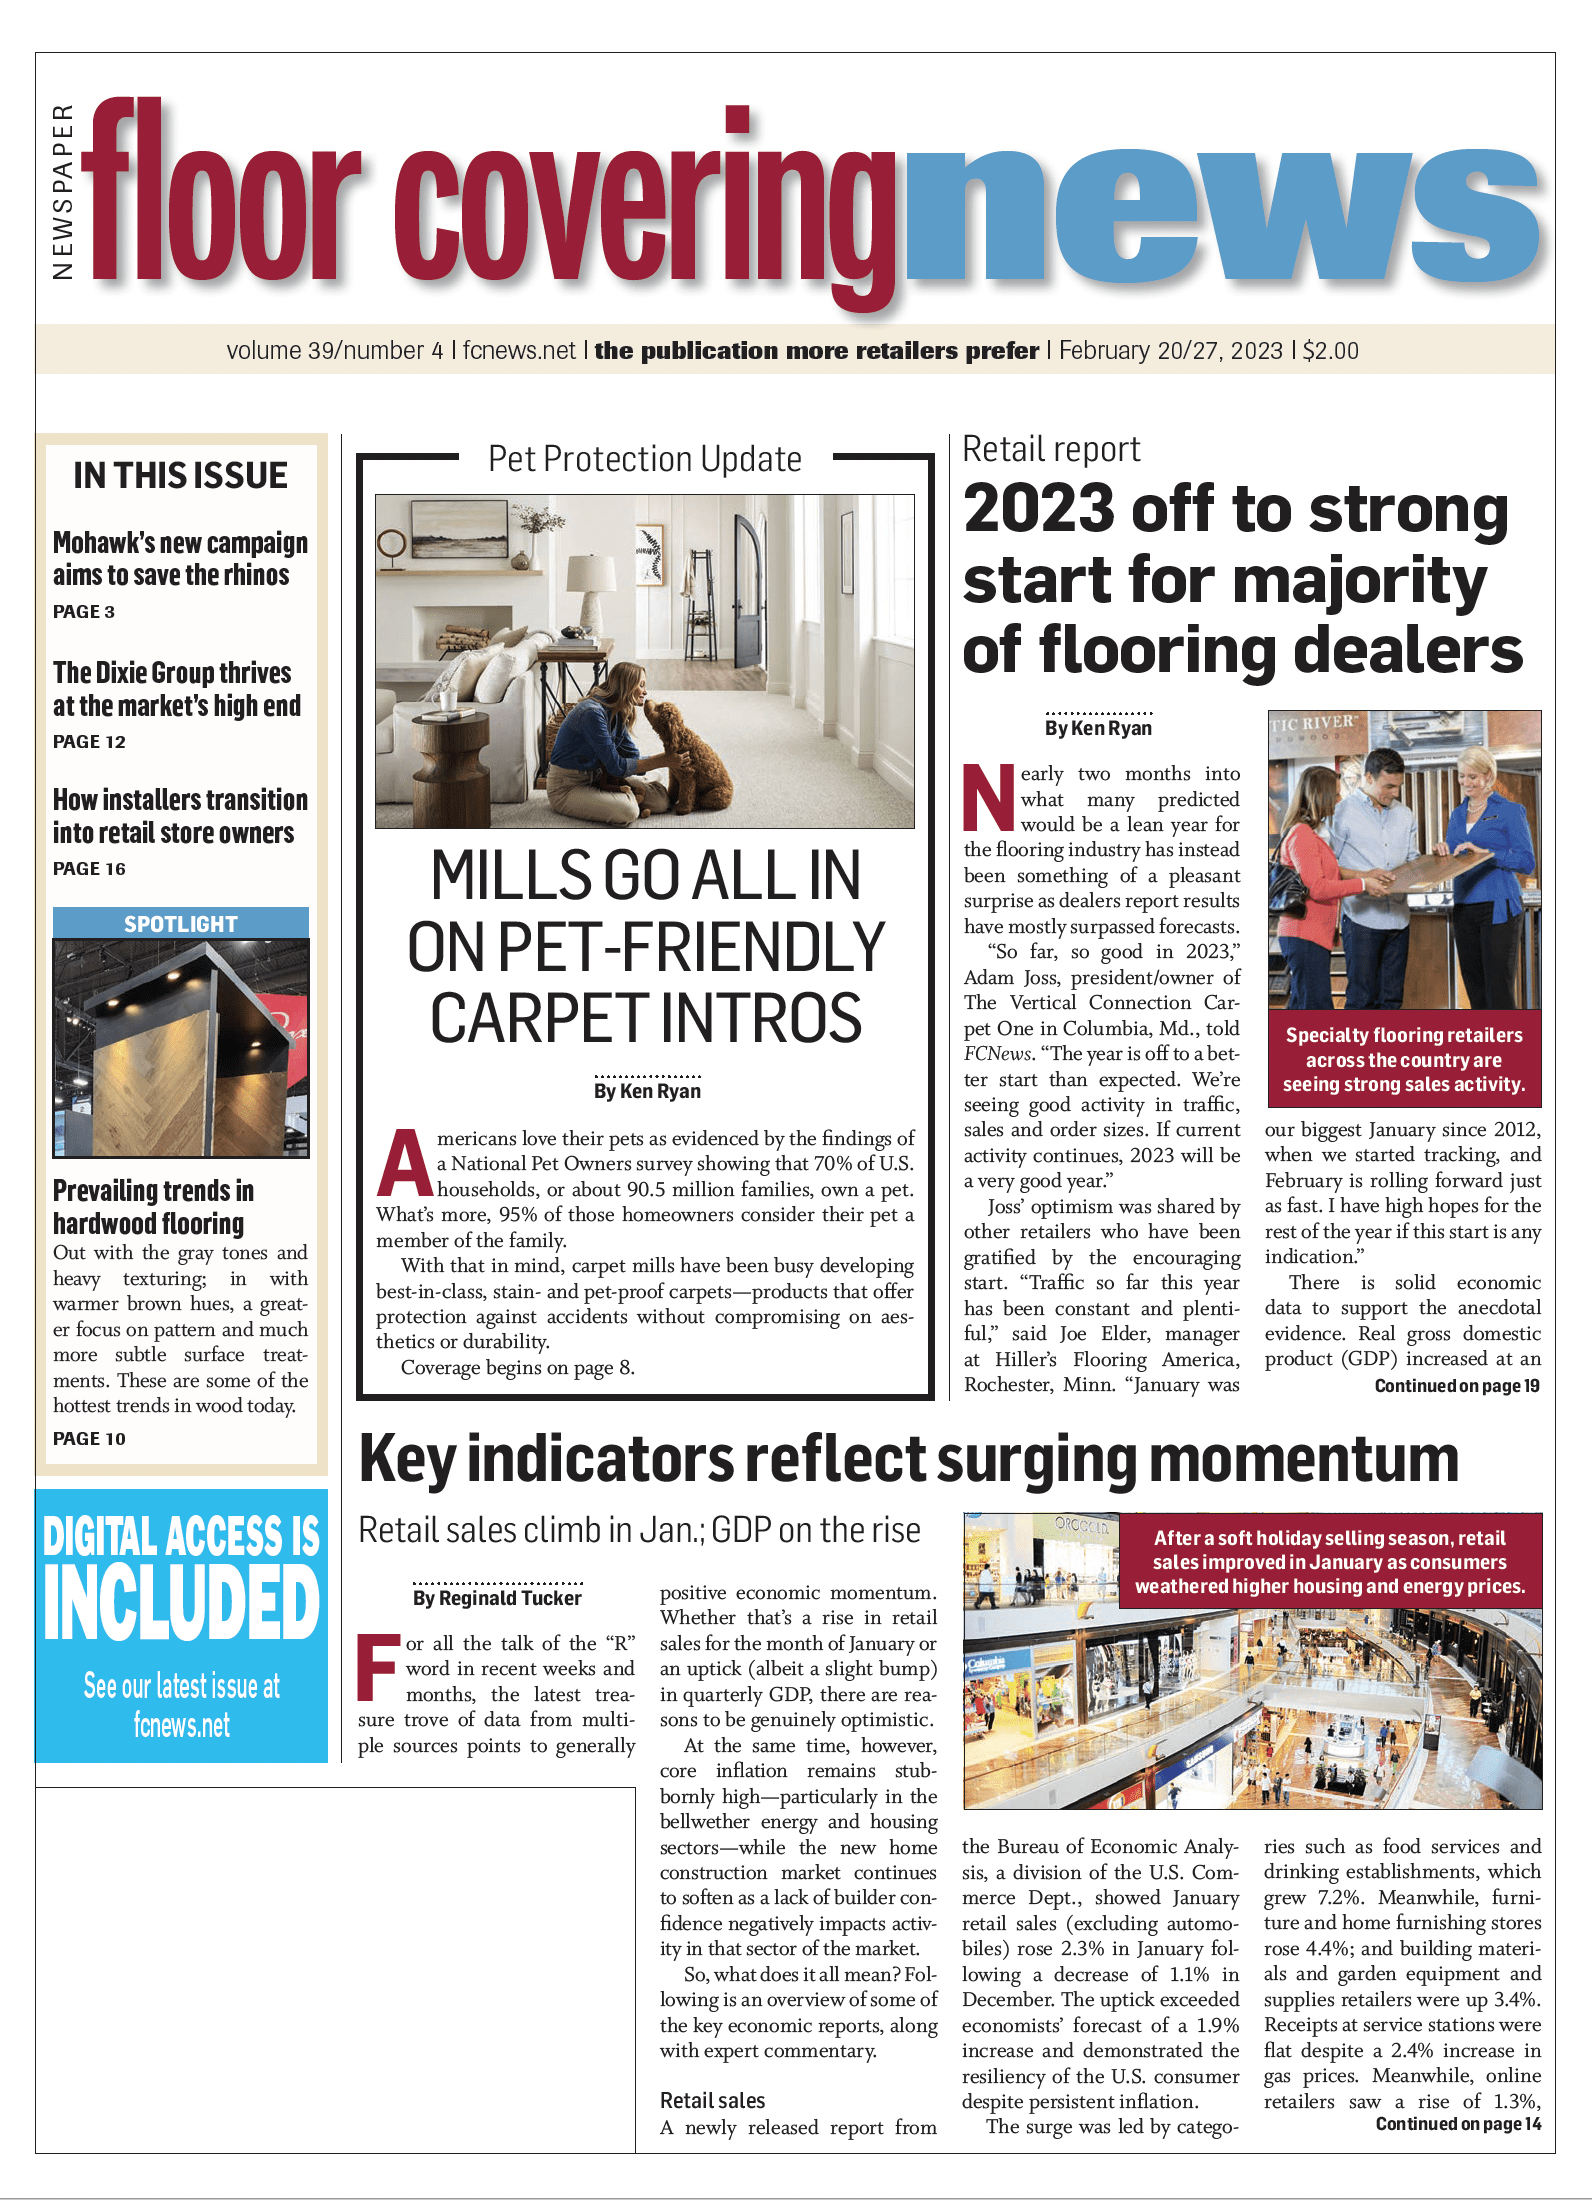
For all the talk of the “R” word in recent weeks and months, the latest treasure trove of data from multiple sources points to generally positive economic momentum. Whether that’s a rise in retail sales for the month of January or an uptick (albeit a slight bump) in quarterly GDP, there are reasons to be genuinely optimistic.
At the same time, however, core inflation remains stubbornly high—particularly in the bellwether energy and housing sectors—while the new home construction market continues to soften as a lack of builder confidence negatively impacts activity in that sector of the market.
So, what does it all mean? Following is an overview of some of the key economic reports, along with expert commentary.
Retail sales

A newly released report from the Bureau of Economic Analysis, a division of the U.S. Commerce Dept., showed January retail sales (excluding automobiles) rose 2.3% in January following a decrease of 1.1% in December. The uptick exceeded economists’ forecast of a 1.9% increase and demonstrated the resiliency of the U.S. consumer despite persistent inflation.
The surge was led by categories such as food services and drinking establishments, which grew 7.2%. Meanwhile, furniture and home furnishing stores rose 4.4%; and building materials and garden equipment and supplies retailers were up 3.4%. Receipts at service stations were flat despite a 2.4% increase in gas prices. Meanwhile, online retailers saw a rise of 1.3%, while electronics and appliances stores increased 3.5%. But perhaps the most intriguing aspect of the monthly retail sales report is no category saw a decline.
GDP holds steady
The U.S. Commerce Department reported fourth-quarter gross domestic product (GDP) rose at a 2.9% annualized pace during the October-to-December 2022 period, right in line with estimates from Dow Jones economists.
Digging deeper into the GDP number—which comprises the sum of all goods and services produced during a given period—consumer spending increased 2.1% for the period. Although that’s down slightly from 2.3% in the previous period, it’s still trending positive, economists stated. (Note: consumer spending accounts for roughly 68% of GDP.)
The personal consumption expenditures price index increased 3.2%, in line with expectations but down sharply from 4.8% in the third quarter. Excluding food and energy, the chain-weighted index rose 3.9%, down from 4.7%. Along with the boost from consumers, increases in private inventory investment, government spending and nonresidential fixed investment helped lift the GDP number.
Federal government spending rose 6.2%, due largely to an 11.2% surge on nondefense outlays, while state and local expenditures were up 2.3%. Government spending in total added 0.64 percentage points to GDP.
Inventory increases also played a significant role, adding nearly 1.5 percentage points. On the downside, residential fixed investment plunged by 26.7%, reflecting a sharp slide in housing. Combined with a 1.3% decline in imports, this served as a drag on overall GDP.
Following 2021, a year that saw GDP rise at its strongest pace since 1984, the first two quarters of 2022 started off with negative movement, matching a commonly held definition of a recession. However, a resilient consumer and strong labor market helped growth turn positive in the final two quarters and provided a spark for 2023.
However, experts advise caution. “Just as the economy wasn’t as weak in the first half of 2022, as GDP reports suggested, it’s also not as strong as the Q4 GDP release would indicate,” wrote Jim Baird, chief investment officer at Plante Moran Financial Advisors. “Held aloft by resilient consumer spending, the economy expanded at a solid pace late last year but remains vulnerable to a more pronounced slowdown in the coming quarters.”
Inflation still stubborn

A key measure of inflation, the Consumer Price Index for All Urban Consumers (CPI-U), rose 0.5% in January on a seasonally adjusted basis after increasing 0.1% in December, according to the U.S. Bureau of Labor Statistics. Over the last 12 months, the “all items” index increased 6.4% before seasonal adjustment. Note: The rate of inflation this time last year was nearly 8%.
Shelter, motor vehicle insurance, recreation, apparel and household furnishings and operations indices all rose. The index for shelter was by far the largest contributor to the monthly all items increase, accounting for nearly half of the increase, with the indices for food, gasoline and natural gas also contributing. The food index increased 0.5% over the month with the food at home index rising 0.4%. The energy index increased 2% in January. However, the indices for used cars and trucks, medical care and airline fares decreased in January.
While the rate of inflation has been moving (albeit painfully slow) in the right direction, observers advise keeping things in the proper perspective. “While inflation fell from 6.5% Y-o-Y in 12/22 to 6.4% in 1/23, and core inflation similarly declined from 5.7% to 5.6%—its fourth straight decline—the declines are moderating,” said Elliot Eisenberg (a.k.a. the “Bowtie Economist”) and president and chief economist of Graphsandlaughs.net. “Worse, core-services inflation, which excludes energy and is the Fed’s favorite measure, has not declined for 17 straight months and is up 7.2% Y-o-Y. Inflation is migrating to services, and the Fed will surely raise rates 25bps in March and May.”
It’s precisely that ongoing trend of rising interest rate increases that has economists concerned. With the Fed’s stated goal of bringing the rate of inflation down to an arbitrary 2%, well below its current rate of 6.4%, the fear is that the Fed’s preferred trade-off of higher unemployment in exchange for lower inflation could have a deleterious effect on economic activity in key sectors such as industrial production. If it continues on its current track, the deceleration in the rate of industrial production—according to ITR Economics—will transition to actual decline in the annual trend (the 12-month moving average) as we enter the fourth quarter of this year. “To mitigate the risk of that decline pushing beyond 2024 or coming in more severe than the relatively mild trend we are forecasting, the Federal Reserve will need to relax its aggressive monetary policy before we move past mid-2023—i.e., before the industrial decline actually commences,” said Alan Beaulieu, president, ITR.
Employment activity
The U.S. Bureau of Labor Statistics reported non-farm payrolls increased by 517,000 in January, exceeding the Dow Jones estimate of 187,000 and nearly doubling December’s gain of 260,000. The latest gains pushed the unemployment rate lower to 3.4%—the lowest jobless level since May 1969. Moreover, the labor force participation rate edged higher to 62.4%, with the largest gains seen in leisure/hospitality, business services and healthcare, to name a few.
“It was a phenomenal report,” said Michelle Meyer, chief U.S. economist at the Mastercard Economics Institute. “This brings into question how we’re able to see that level of job growth despite some of the other rumblings in the economy. The reality is it shows there’s still a lot of pent-up demand for workers where companies have really struggled to staff appropriately.”
While there have been highly publicized layoffs in the tech sector, many observers attribute those reductions to the need for employers to scale back overly aggressive hiring moves made over the past three years. Many of these firms, experts said, are now attempting to “right-size” their organizations as a means to improve profitability.
As Graphsandlaughs.net’s Eisenberg noted: “While many firms are laying off staff—be it Amazon winnowing 18,000 or Disney culling 7,000—they all cut roughly 5% of their workforce. These firms probably decided in late 2022, based on economic conditions, to start layoffs in early 2023. Others took advantage of layoffs elsewhere to implement opportunistic layoffs to mollify investors, while some overhired. If the cuts are much deeper, that suggests something more company-specific.”
All in all, observers say the key metrics are still favorable. “The monthly reports on industrial production, retail sales and jobs were generally better than expected and point to a pickup in economic activity in early 2023 after a soft patch in late 2022,” wrote Bill Adams, chief economist for Comerica Bank. “The Fed will read recent activity reports as supporting plans for additional interest rate increases in the first half of this year.”
Housing starts slide

Housing continued to stumble in January, falling by 4.5% to a seasonally adjusted annual rate of 1.31 million—and down from the revised December estimate of 1.37 million, according to the U.S. Census Bureau. (The seasonally adjusted January reading of 1.31 million starts is the number of housing units builders would begin if development kept this pace for the next 12 months.) Within this overall number, single-family starts decreased 4.3% to a seasonally adjusted annual rate of 841,000 units, while the multi-family sector, which includes apartment buildings and condos, decreased 4.9% to an annualized 468,000 pace.
Moreover, the drop marked five straight months of declines even as mortgage rates moderated and inflation cooled. And although rising builder sentiment indicates a turning point for housing later this year, lackluster single-family production in January is a sign that the housing sector faces further challenges amid high construction costs, which continue to put a damper on the market.
“Housing construction weakened in January as ongoing affordability conditions fueled by high mortgage rates and building material costs challenged the market,” said Alicia Huey, chairman of the National Association of Home Builders (NAHB) and a custom home builder and developer from Birmingham, Ala. “And while a recent two-month upturn in builder sentiment indicates a turning point for single-family construction could take hold in the months ahead, policymakers need to fix the supply chain for building materials to ensure builders can add the additional inventory the housing market so desperately needs.”
On a regional basis, combined single-family and multi-family starts were 42.2% lower in the Northeast and 25.9% lower in the Midwest, but 7.3% higher in the South and 5.5% higher in the West, according to NAHB.
Overall permits increased 0.1% to a 1.34 million-unit annualized rate in January. Looking at regional permit data compared to the previous month, permits were 7.8% lower in the Northeast and 4.6% lower in the West, but 1.7% higher in the Midwest and 3% higher in the South.

